
AWP
Webinar Recap: The Gap Nobody Talks About — Between the Model and the Field

On complex industrial projects, construction progress can appear steady until the final stretch, when small gaps suddenly create big delays. A missing spool, late material, or out-of-sequence turnover can hold up commissioning for weeks. To avoid those pitfalls, a global EPC firm turned to O3 on a major greenfield facility, replacing spreadsheets and static dashboards with live, integrated data layered onto a 3D model. The goal was simple: make sure that when the schedule says “95% complete,” the project is truly ready to hand over.
In phase one of the project, completions readiness was managed with spreadsheets and static dashboards. Data went stale almost as soon as it was compiled, fabrication and material status sat in separate silos, and subsystem handovers often slipped out of sequence. Hours went into reconciling mismatched updates, yet teams still lacked confidence at turnover. This is a familiar story across the industry—large capital projects run an average of 20% longer and up to 80% over budget, with poor information flow a frequent culprit.

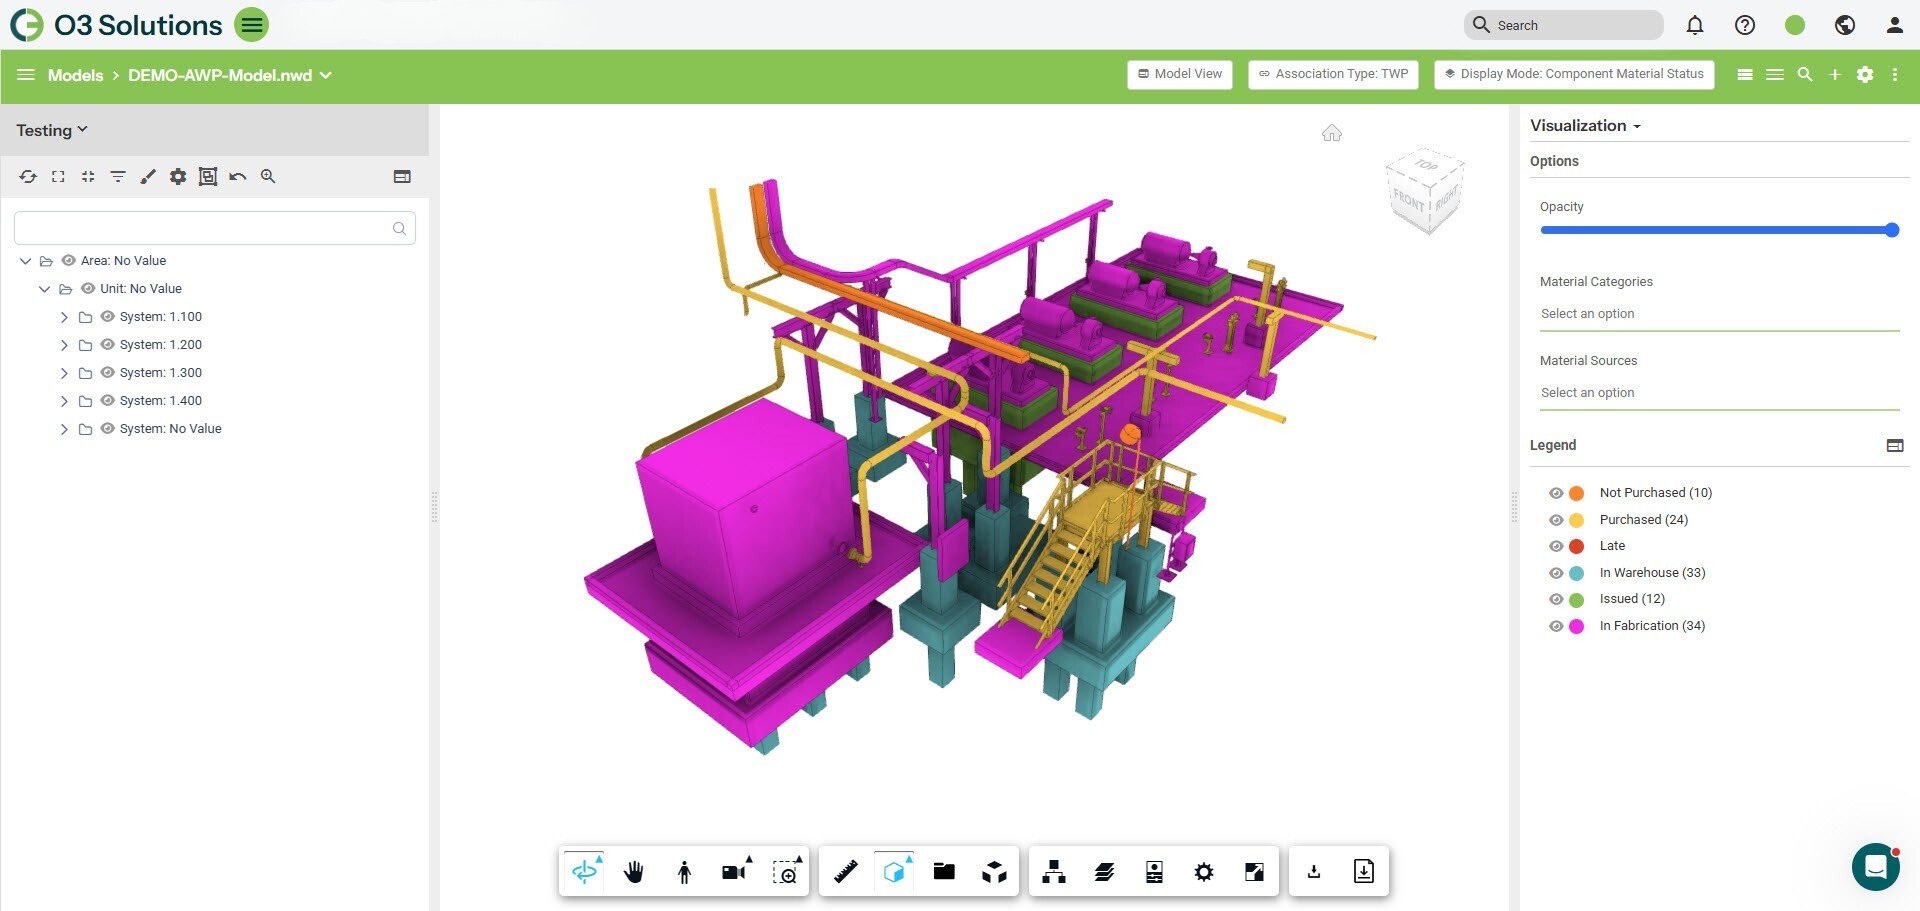
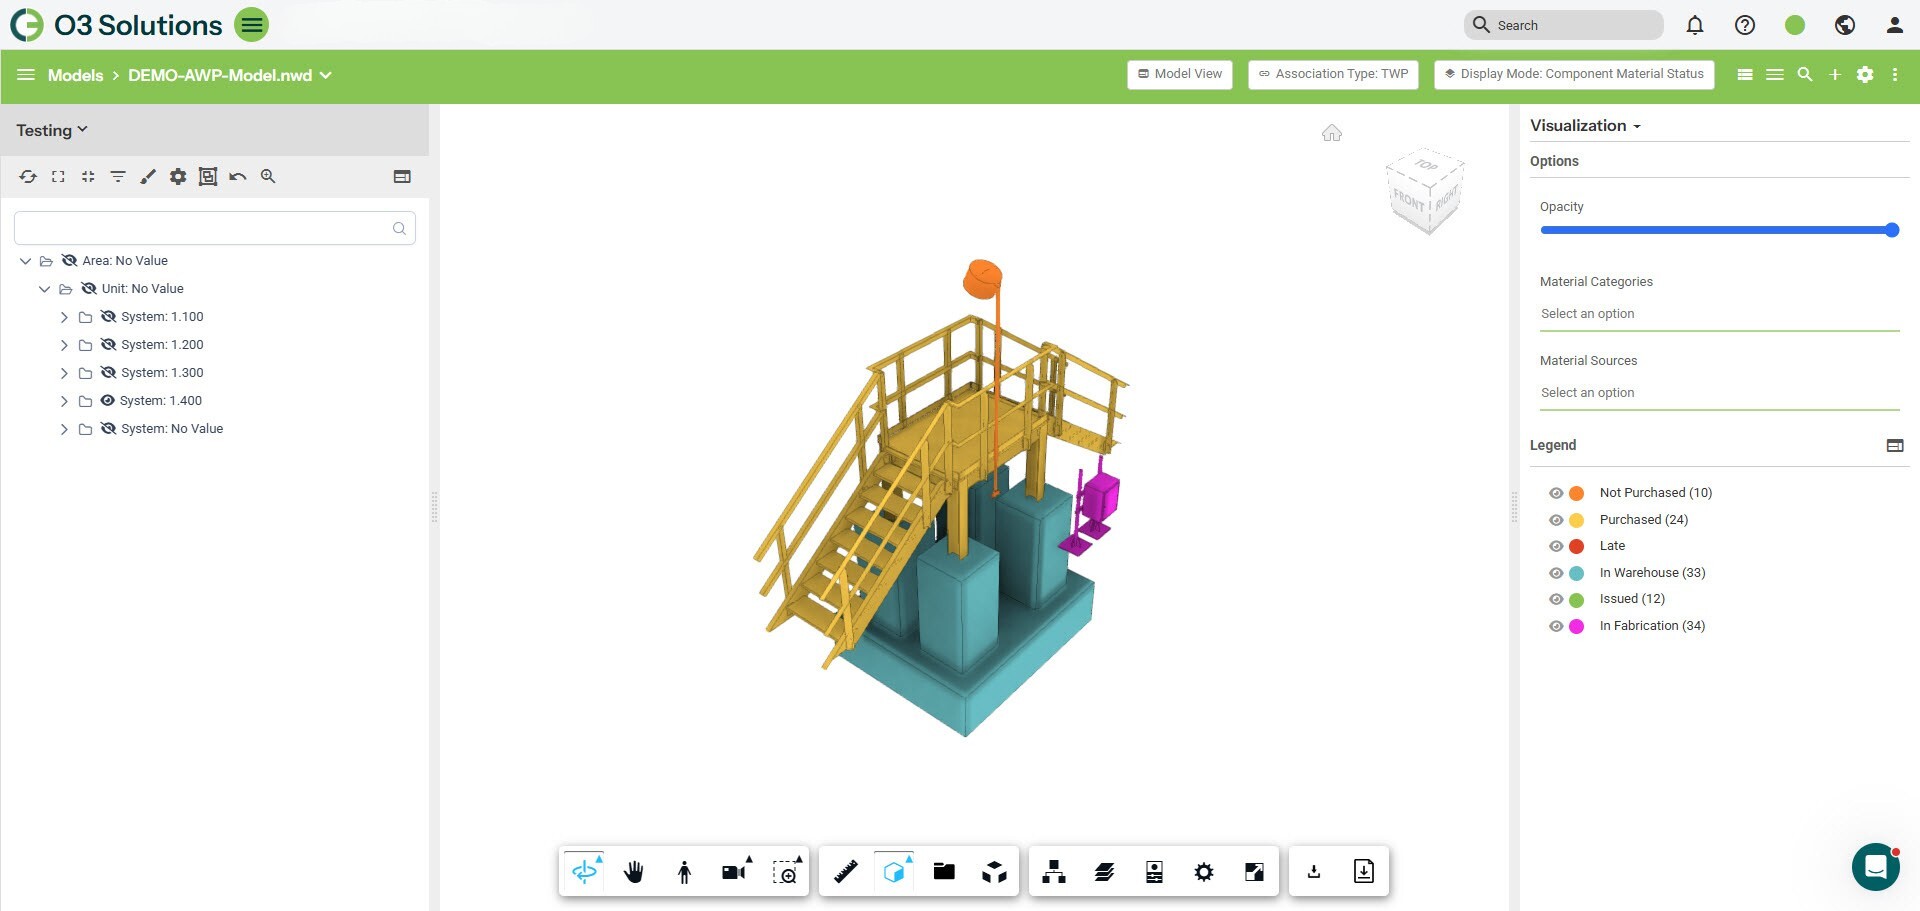
For phase two, the EPC stood up O3 to act as the live layer where construction meets completions. The team overlays subsystem and system hierarchies on the construction view, then tracks what matters at each stage:
Data refreshes on a predictable cadence, weekly in some streams and twice weekly in others, so planners, construction, and pre-commissioning are looking at the same truth. The 3D model helps everyone see readiness, not just read about it. A central analytics portal publishes role-based Power BI dashboards that pull O3 alongside schedule and other sources, so leaders and the Owner get current, consistent views without emailing exports. This is the opposite of the “Excel every Friday” grind that goes stale by Monday. Industry surveys keep stressing why this matters; teams still miss budget and schedule targets due to weak risk and data practices, so reliable, frequent refreshes are a real lever.
Construction is roughly mid-stream. As is common practice, the team will pivot from area-based control to system and subsystem turnover when construction reaches about two-thirds complete. In phase one, that pivot faltered because the integration and data flow were not ready. In phase two, the groundwork is in place: live status overlays, cleaner feeds into dashboards, and a single place to check: “Is this subsystem truly ready?” The owner accesses information through the EPC’s environment, which keeps handover conversations grounded in the same dataset the field is updating.
Advanced Work Packaging (AWP) is not just process; at maturity, it has been shown to lift labor productivity and reduce total installed cost when teams execute it with discipline and data. Reported improvements include 25% productivity gains and 10% TIC reductions when AWP practices are fully embedded. Getting there requires exactly what this project is putting in place: integrated status, standardized reporting, and a consistent view from planning through turnover.
Two integrations will round out the picture. First, tighter schedule connectivity so planned dates and readiness status live side by side without manual touch. Second, a two-way link with the completions platform so punchlist items for a subsystem can be seen in the same 3D context: if a punch is minor, turnover can proceed; if it is blocking, the team knows immediately. We expect a follow-up to this success story when the project crosses the 60–70 percent threshold and begins systemized turnovers at scale.
The combination is simple and powerful: one place to see subsystem readiness with fresh data, one cadence everyone can trust, one set of dashboards the Owner and EPC both use. In a sector where missed targets are still common, tightening the data loop around handover is one of the fastest ways to lower risk.
To learn more about how O3 can transform your handover process and elevate project certainty, schedule your personalized demo today.
Experience how O3 can streamline your project management, reduce costs, and ensure on-time, on-budget delivery. Start your journey to smarter execution today.